Superior network visibility with Insight UI
The Highlight Service Observability Platform offers a clear view of your network’s performance, making it easier for network managers and users to communicate effectively
Immediate recognition and understanding of the state of the network for global IT directors, technical support operatives or branch-level users.
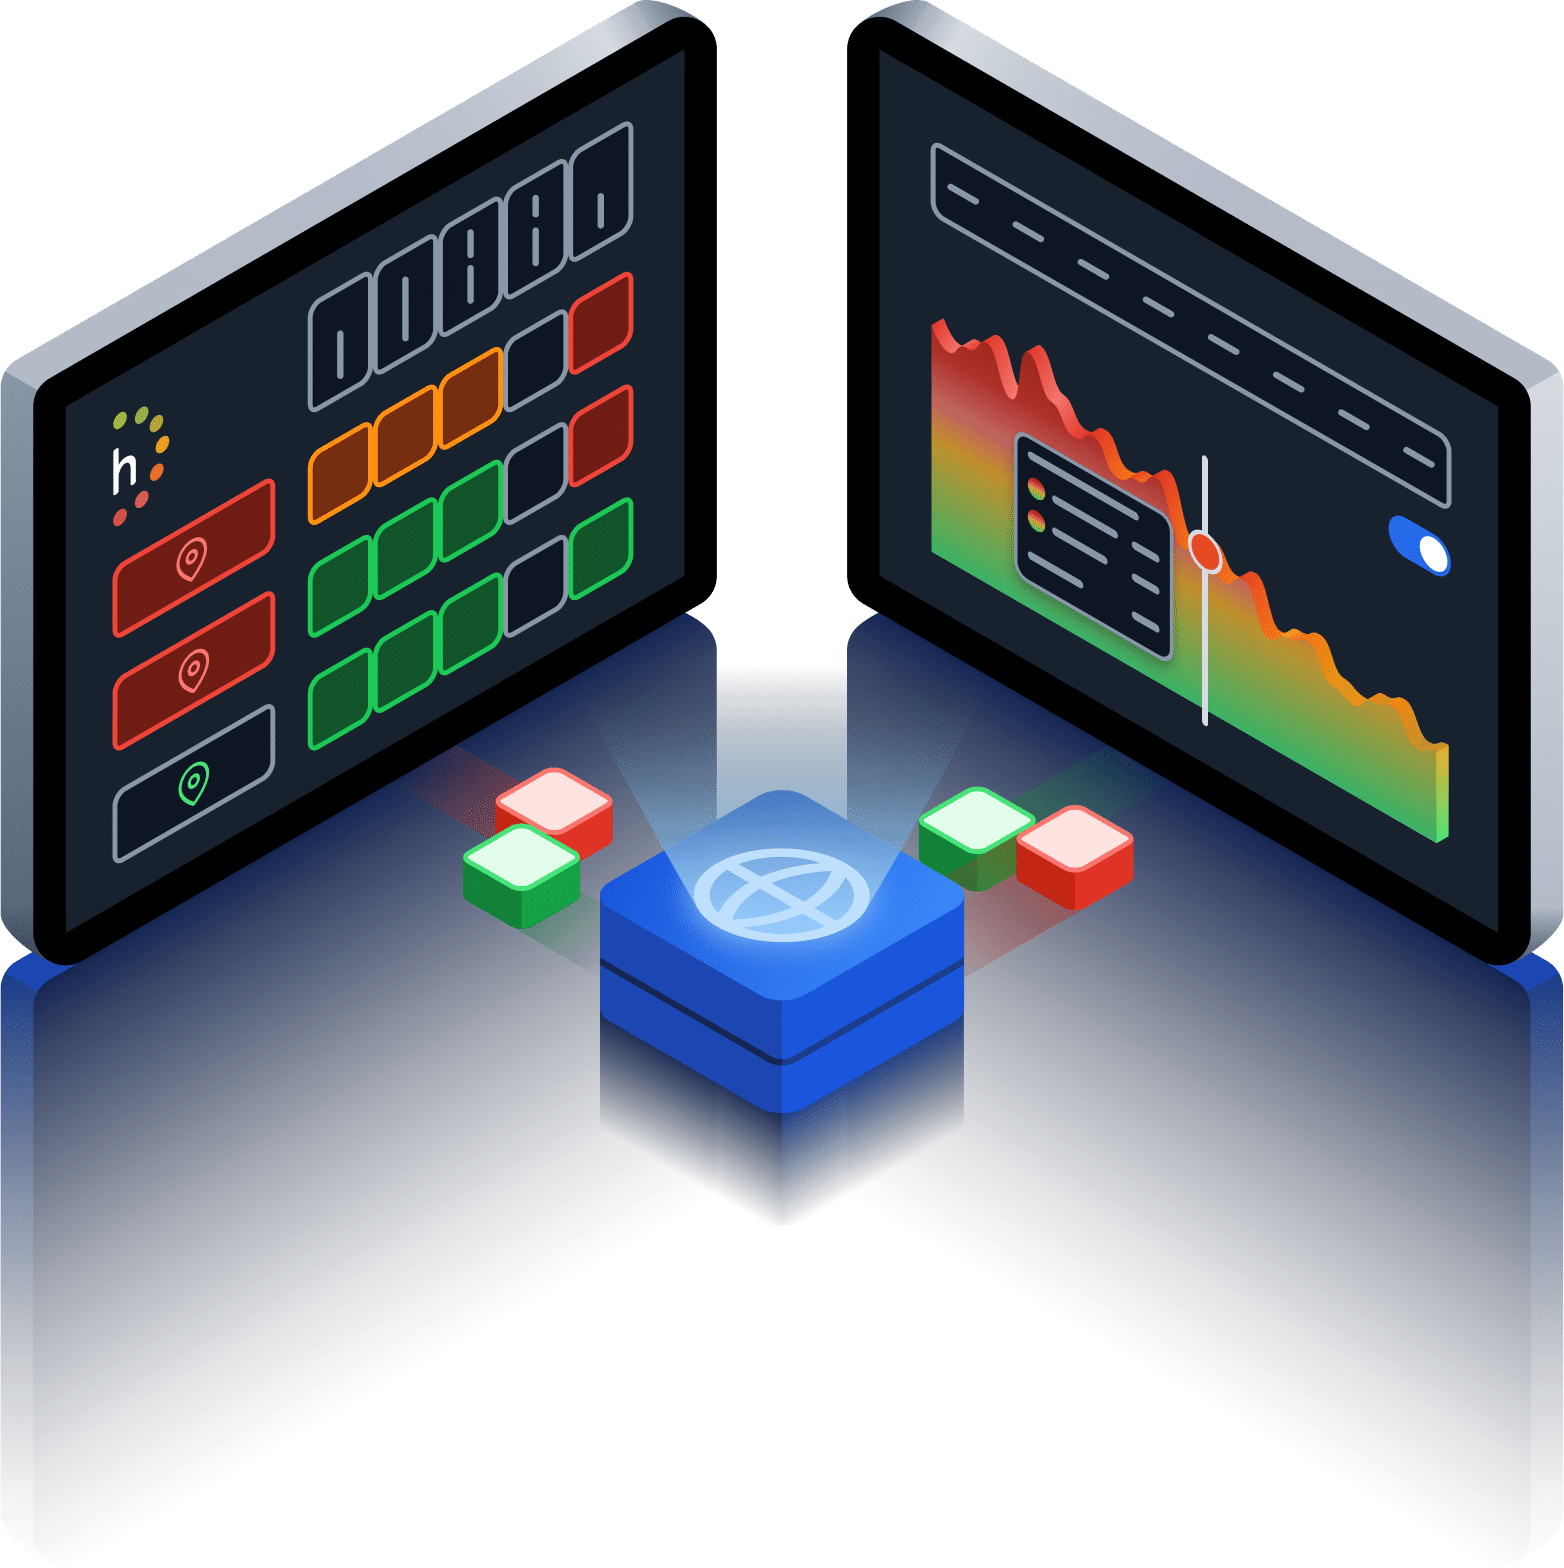
Organisations already succeeding with Highlight
Features
Network visibility at all levels
Too much or too little information hampers effective decision making. Highlight ensures you have the right information at the right time.
See the whole network estate
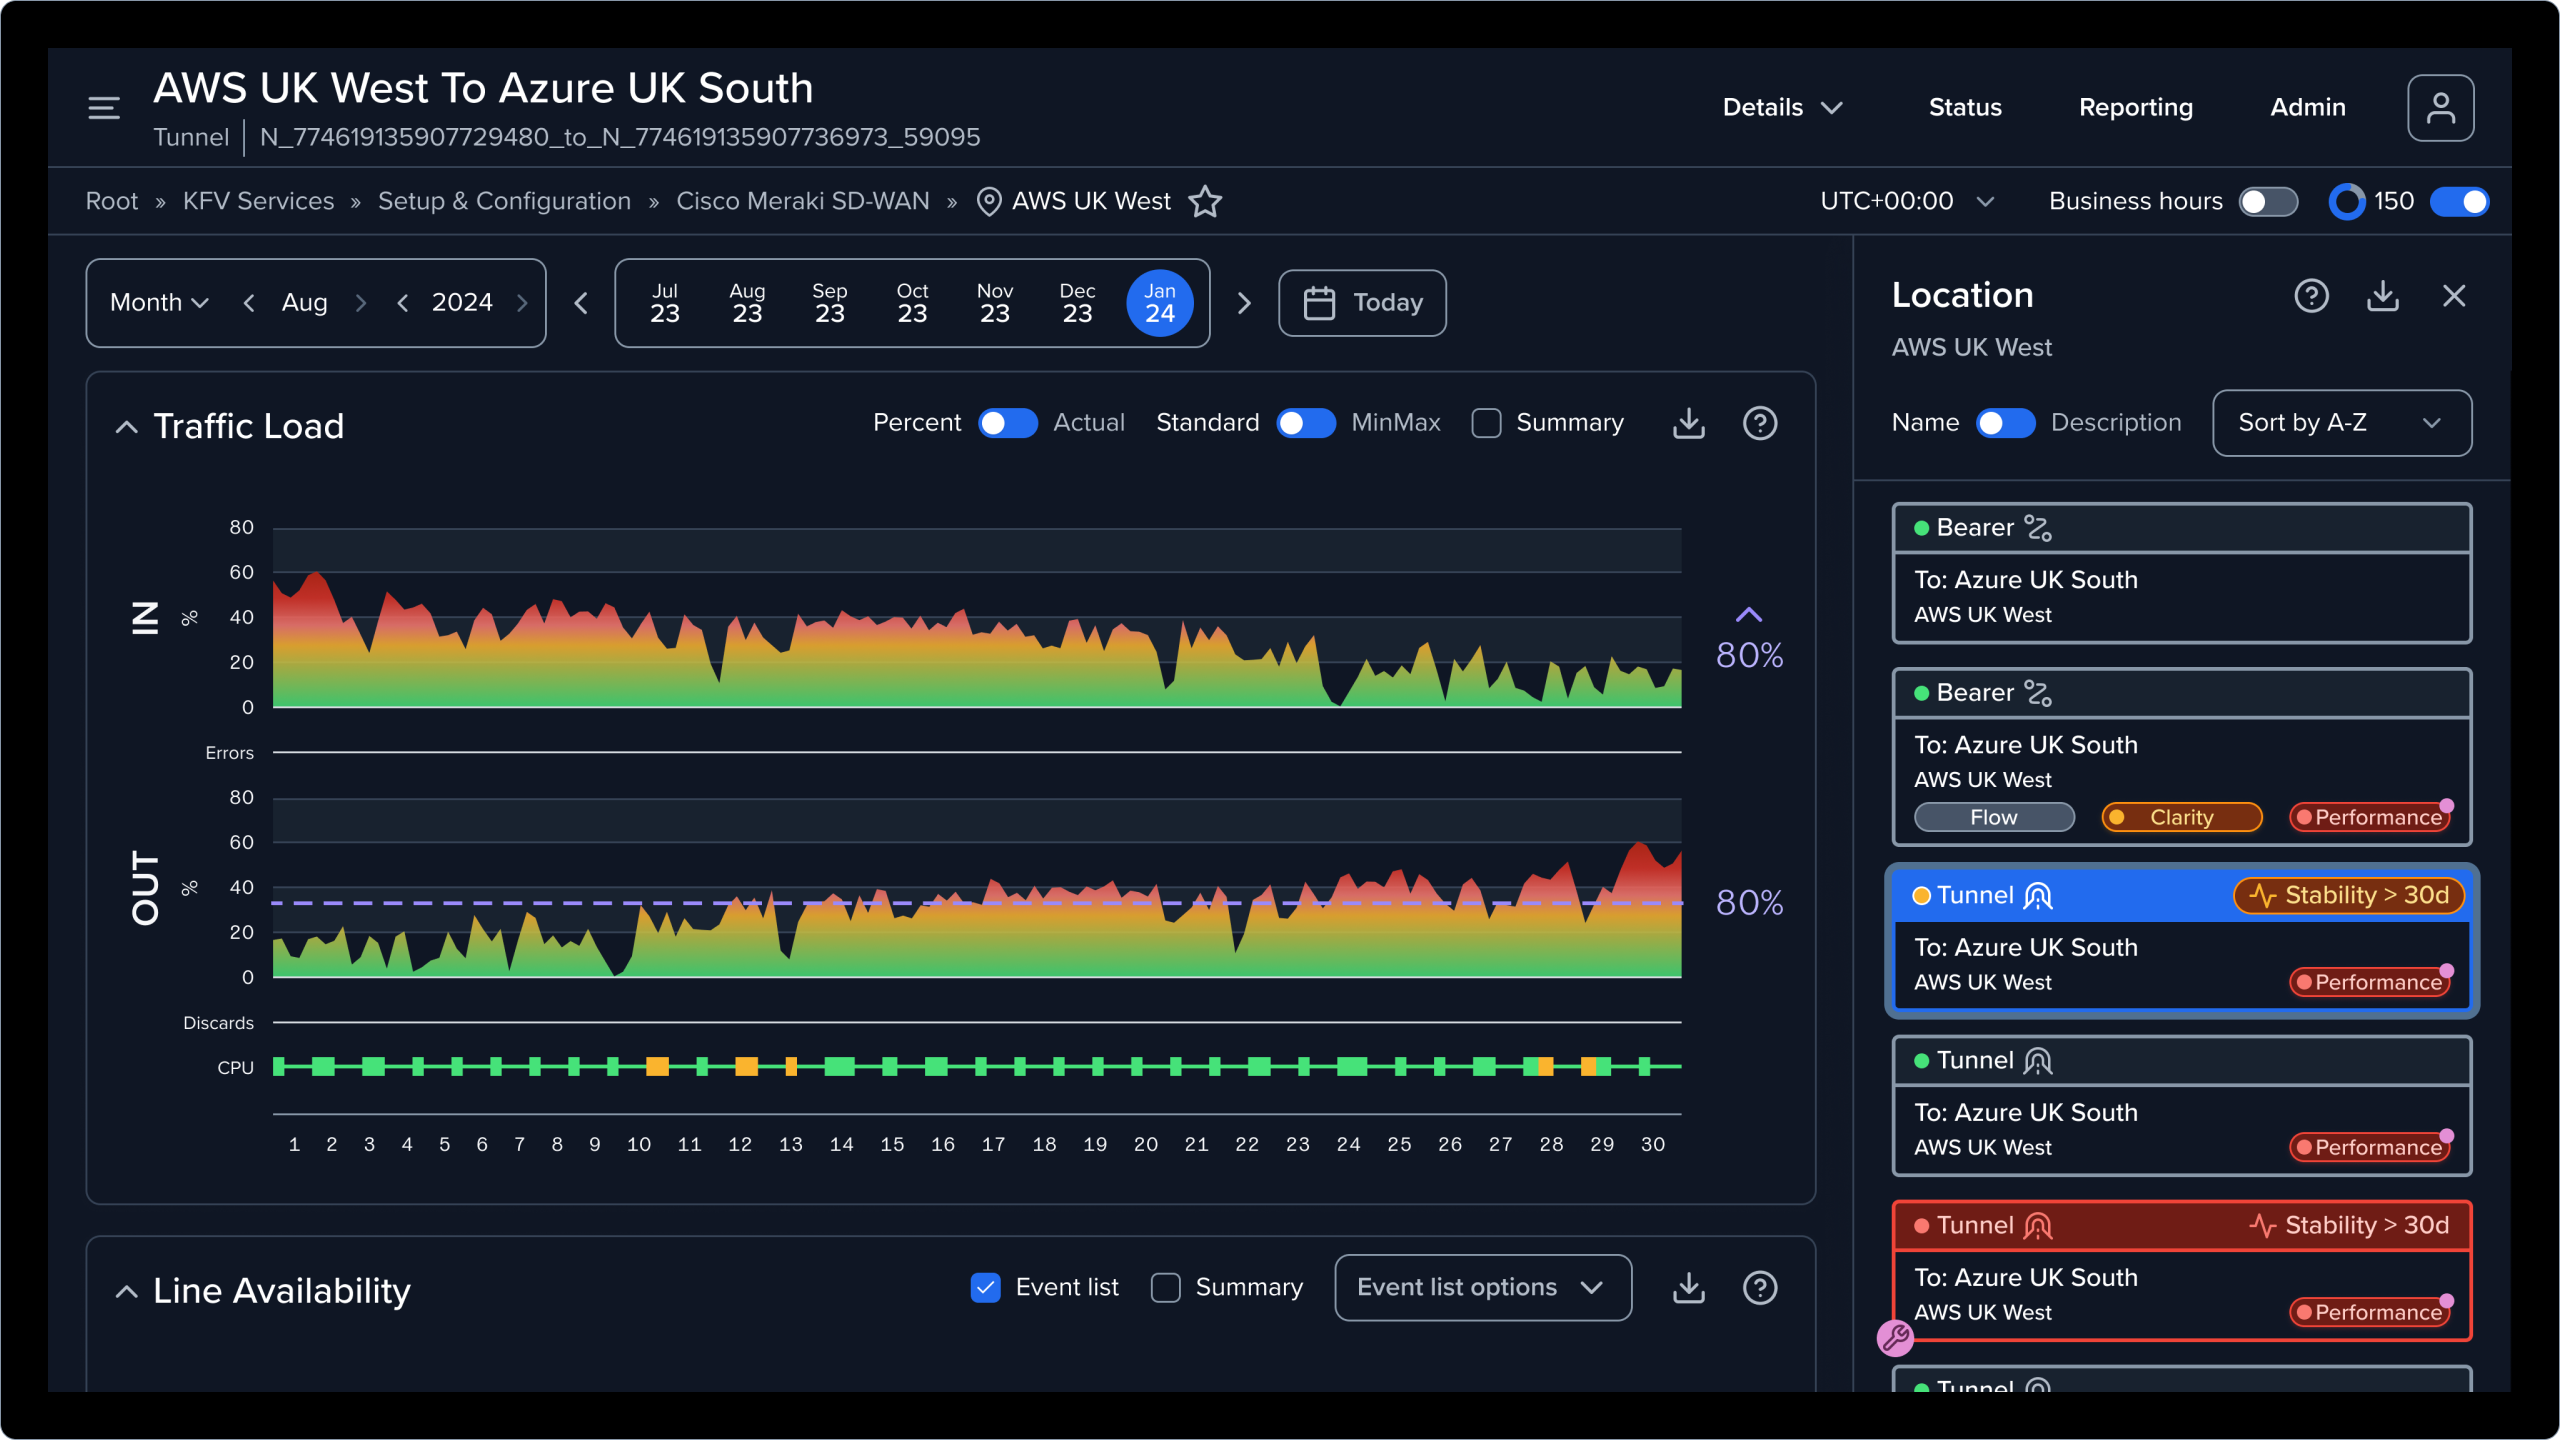
Need to zoom in and isolate specific problem? Quickly click through to a specific location, application test or connection.
Overview to detail in just two clicks
Highlight integrates a wide range of different technologies, and Insight UI lets you see them how you want.
Relevant to regions, teams and users
Native multi-tenancy means specific teams and users can access connections, locations and services grouped in nested folders.
Immediate issue identification
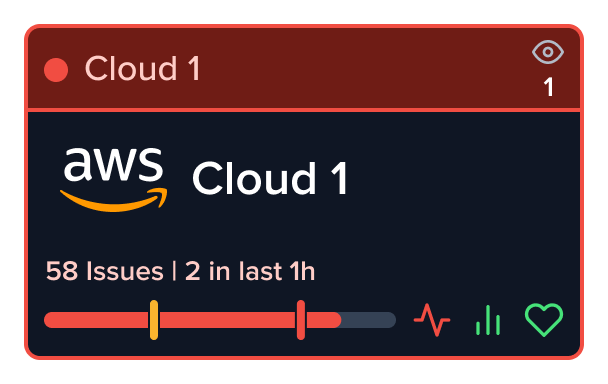
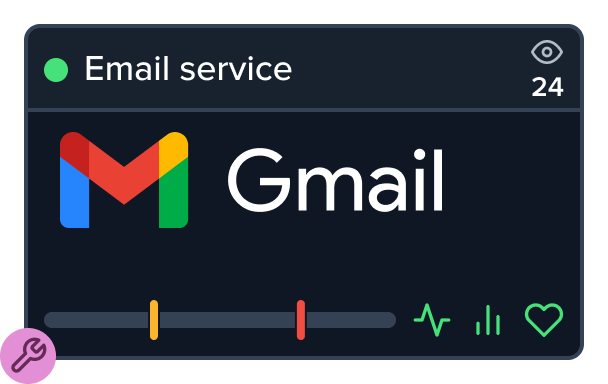
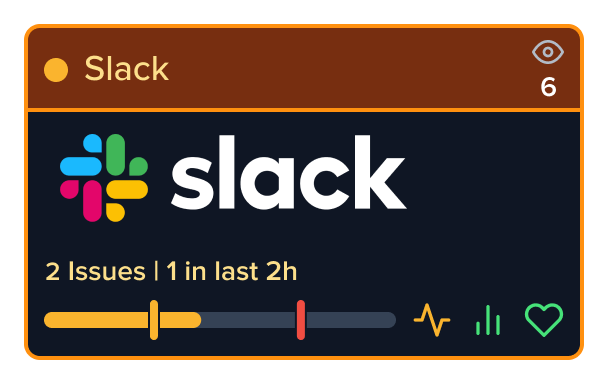
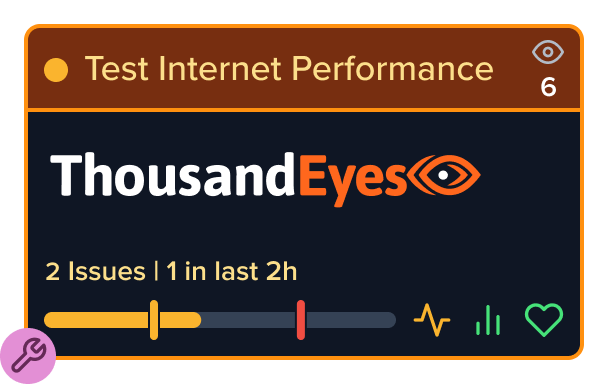
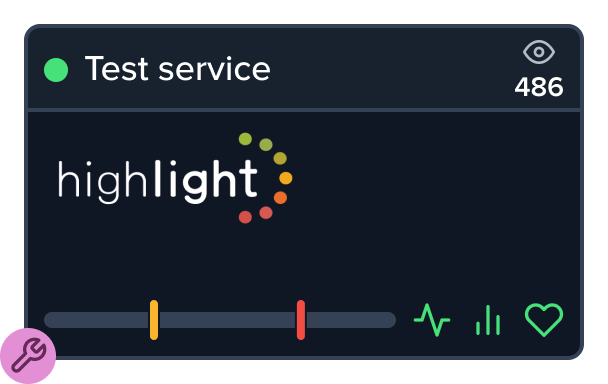
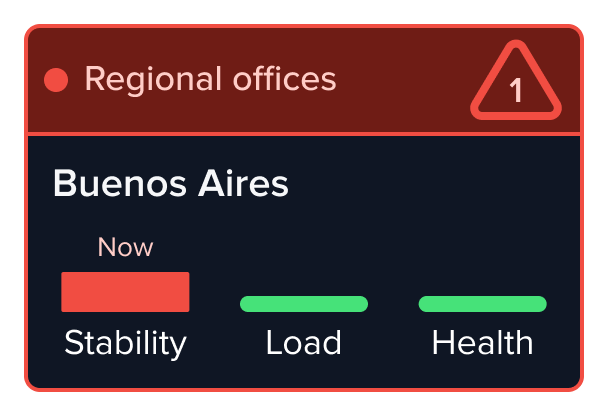
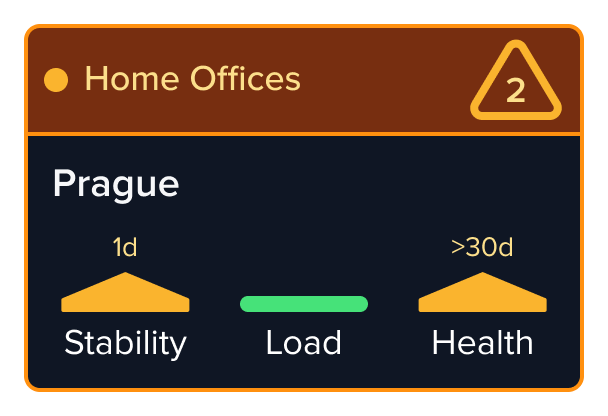
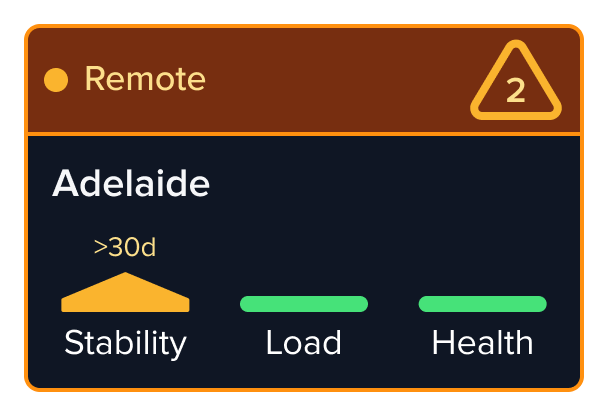
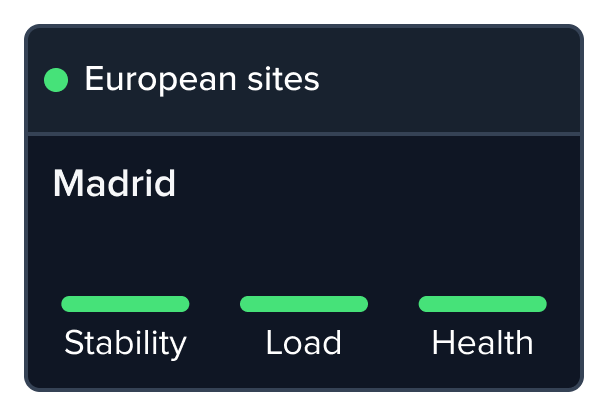
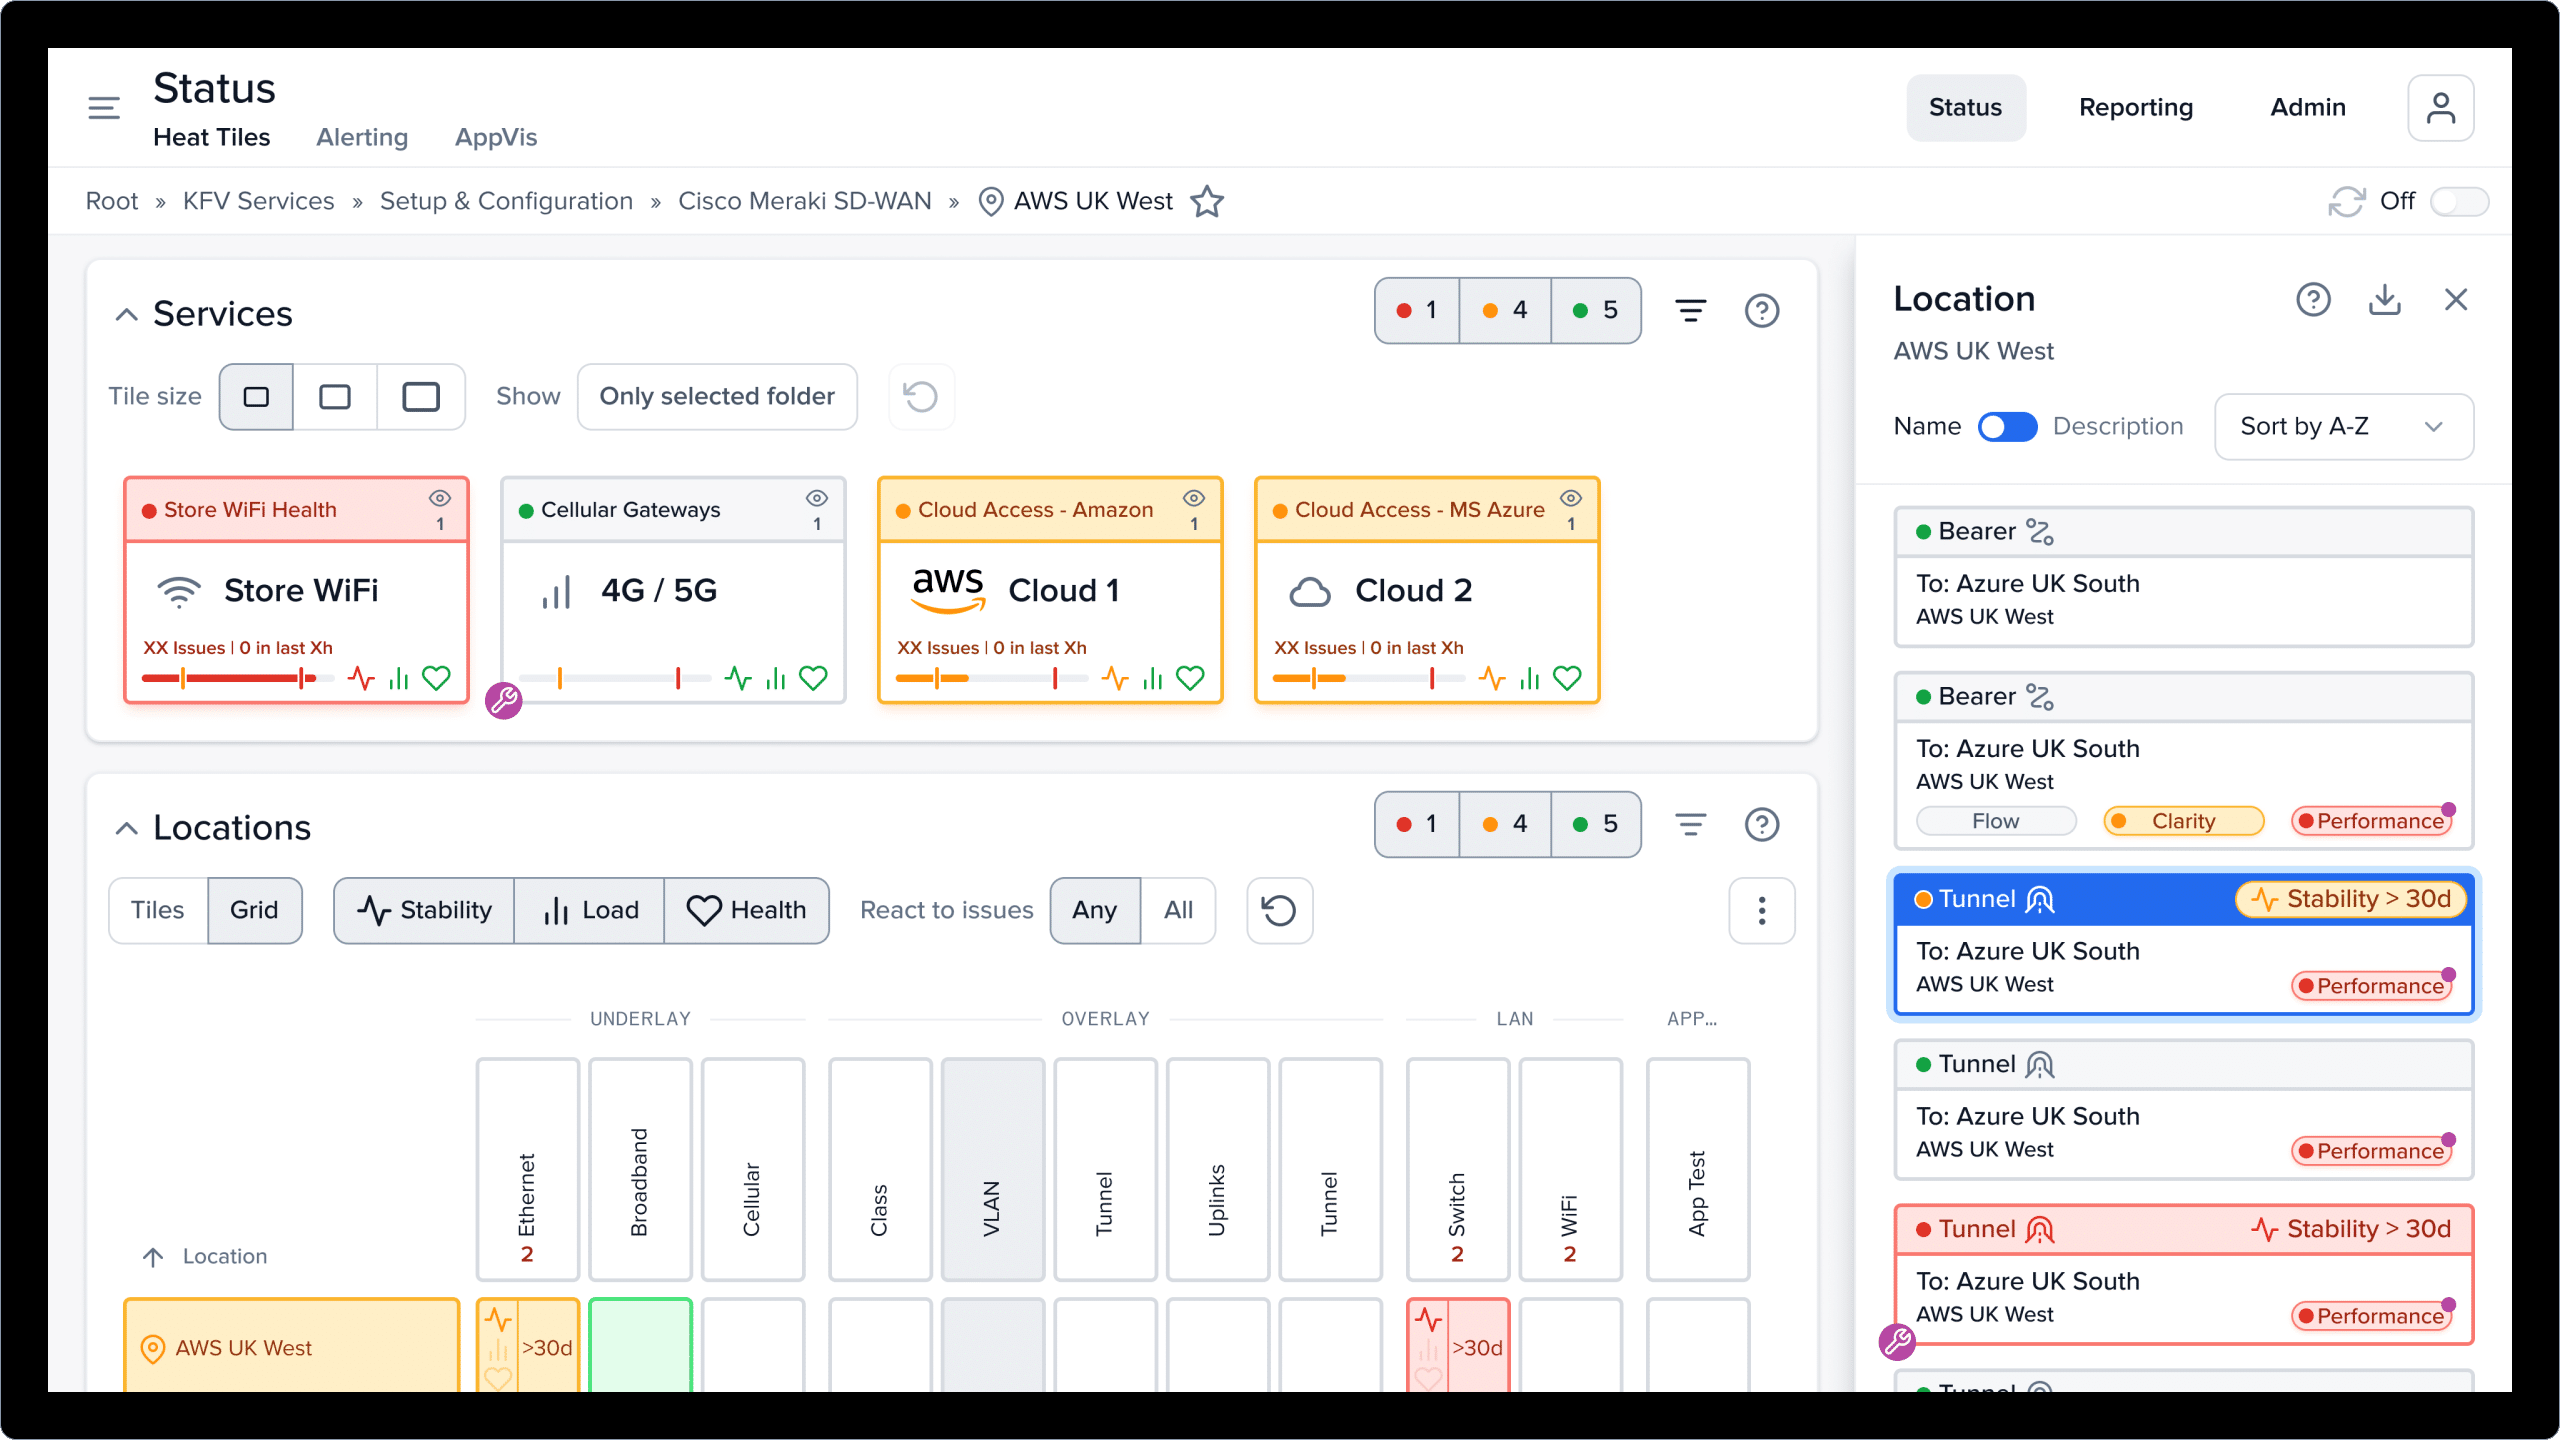
Consistent colour coding indicates what’s working and what isn’t. Green is good, amber means an issue is developing and red means an outage or threshold breach has occurred.
Every location within your network is shown as an individual, summary tile with chevrons to indicate improving or deteriorating issues across stability, load and health metrics.
Insight
Information turned into action
Leverage the data provided by Insight UI to drive action with tools designed for effective IT support and network performance analysis.
Hyper-relevant alerting
Set alerts for any technology or location and notify any relevant teams. Keep false positive alerts to a minimum and keep all issue identification on a single platform.
Unified reporting
Create accurate and relevant reports for stakeholders in minutes. No more collating data from multiple sources or spending hours editing spreadsheets.
Enhanced detail with Grid View
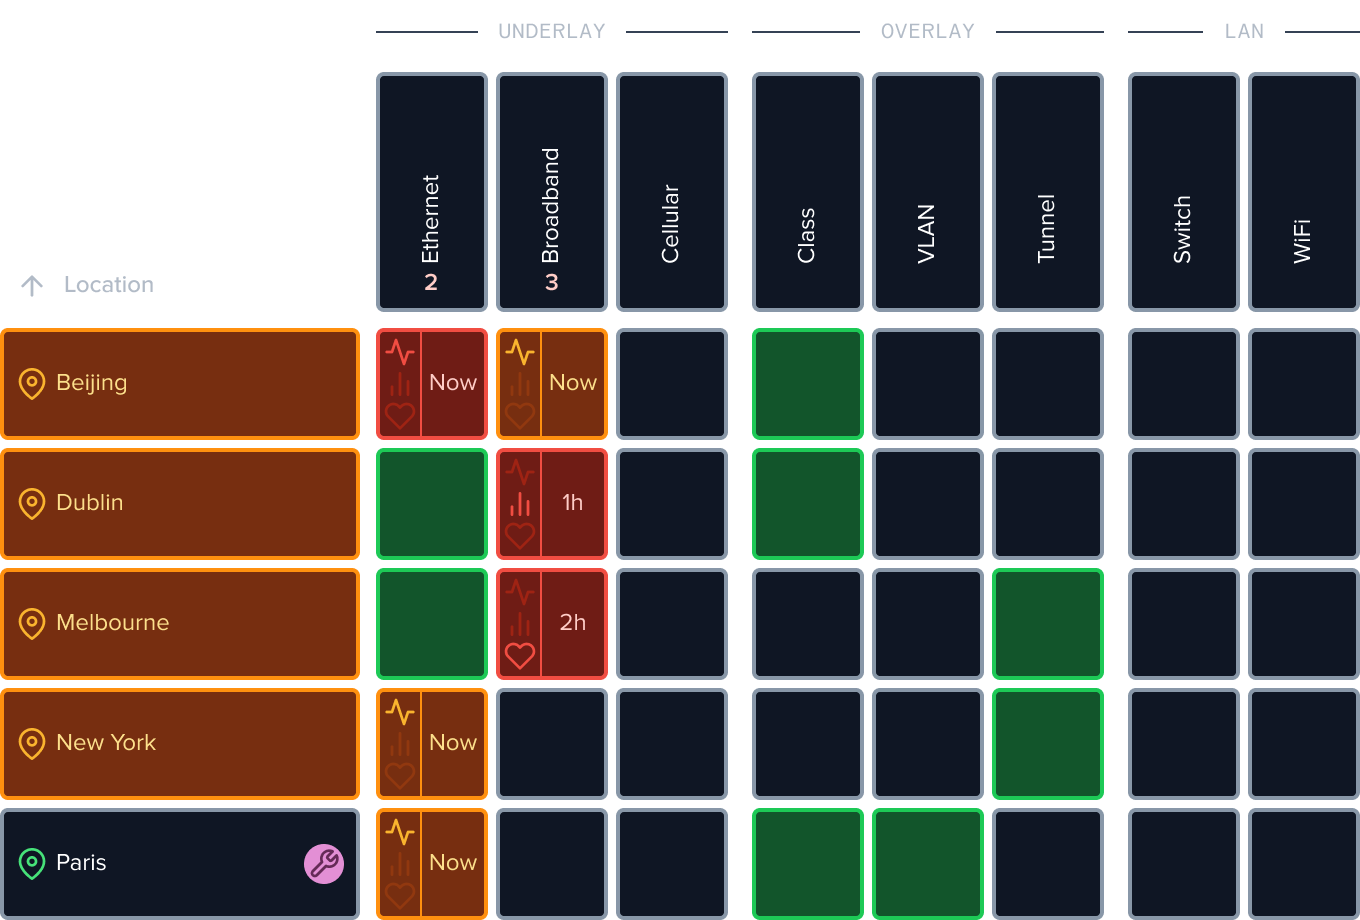
Extended location detail with Grid View for isolating problem technologies.
Scanning the grid vertically shows which locations are having problems and scanning horizontally identifies the status of technology categories.
Interface
Customisable UI elements for enhanced accessibility
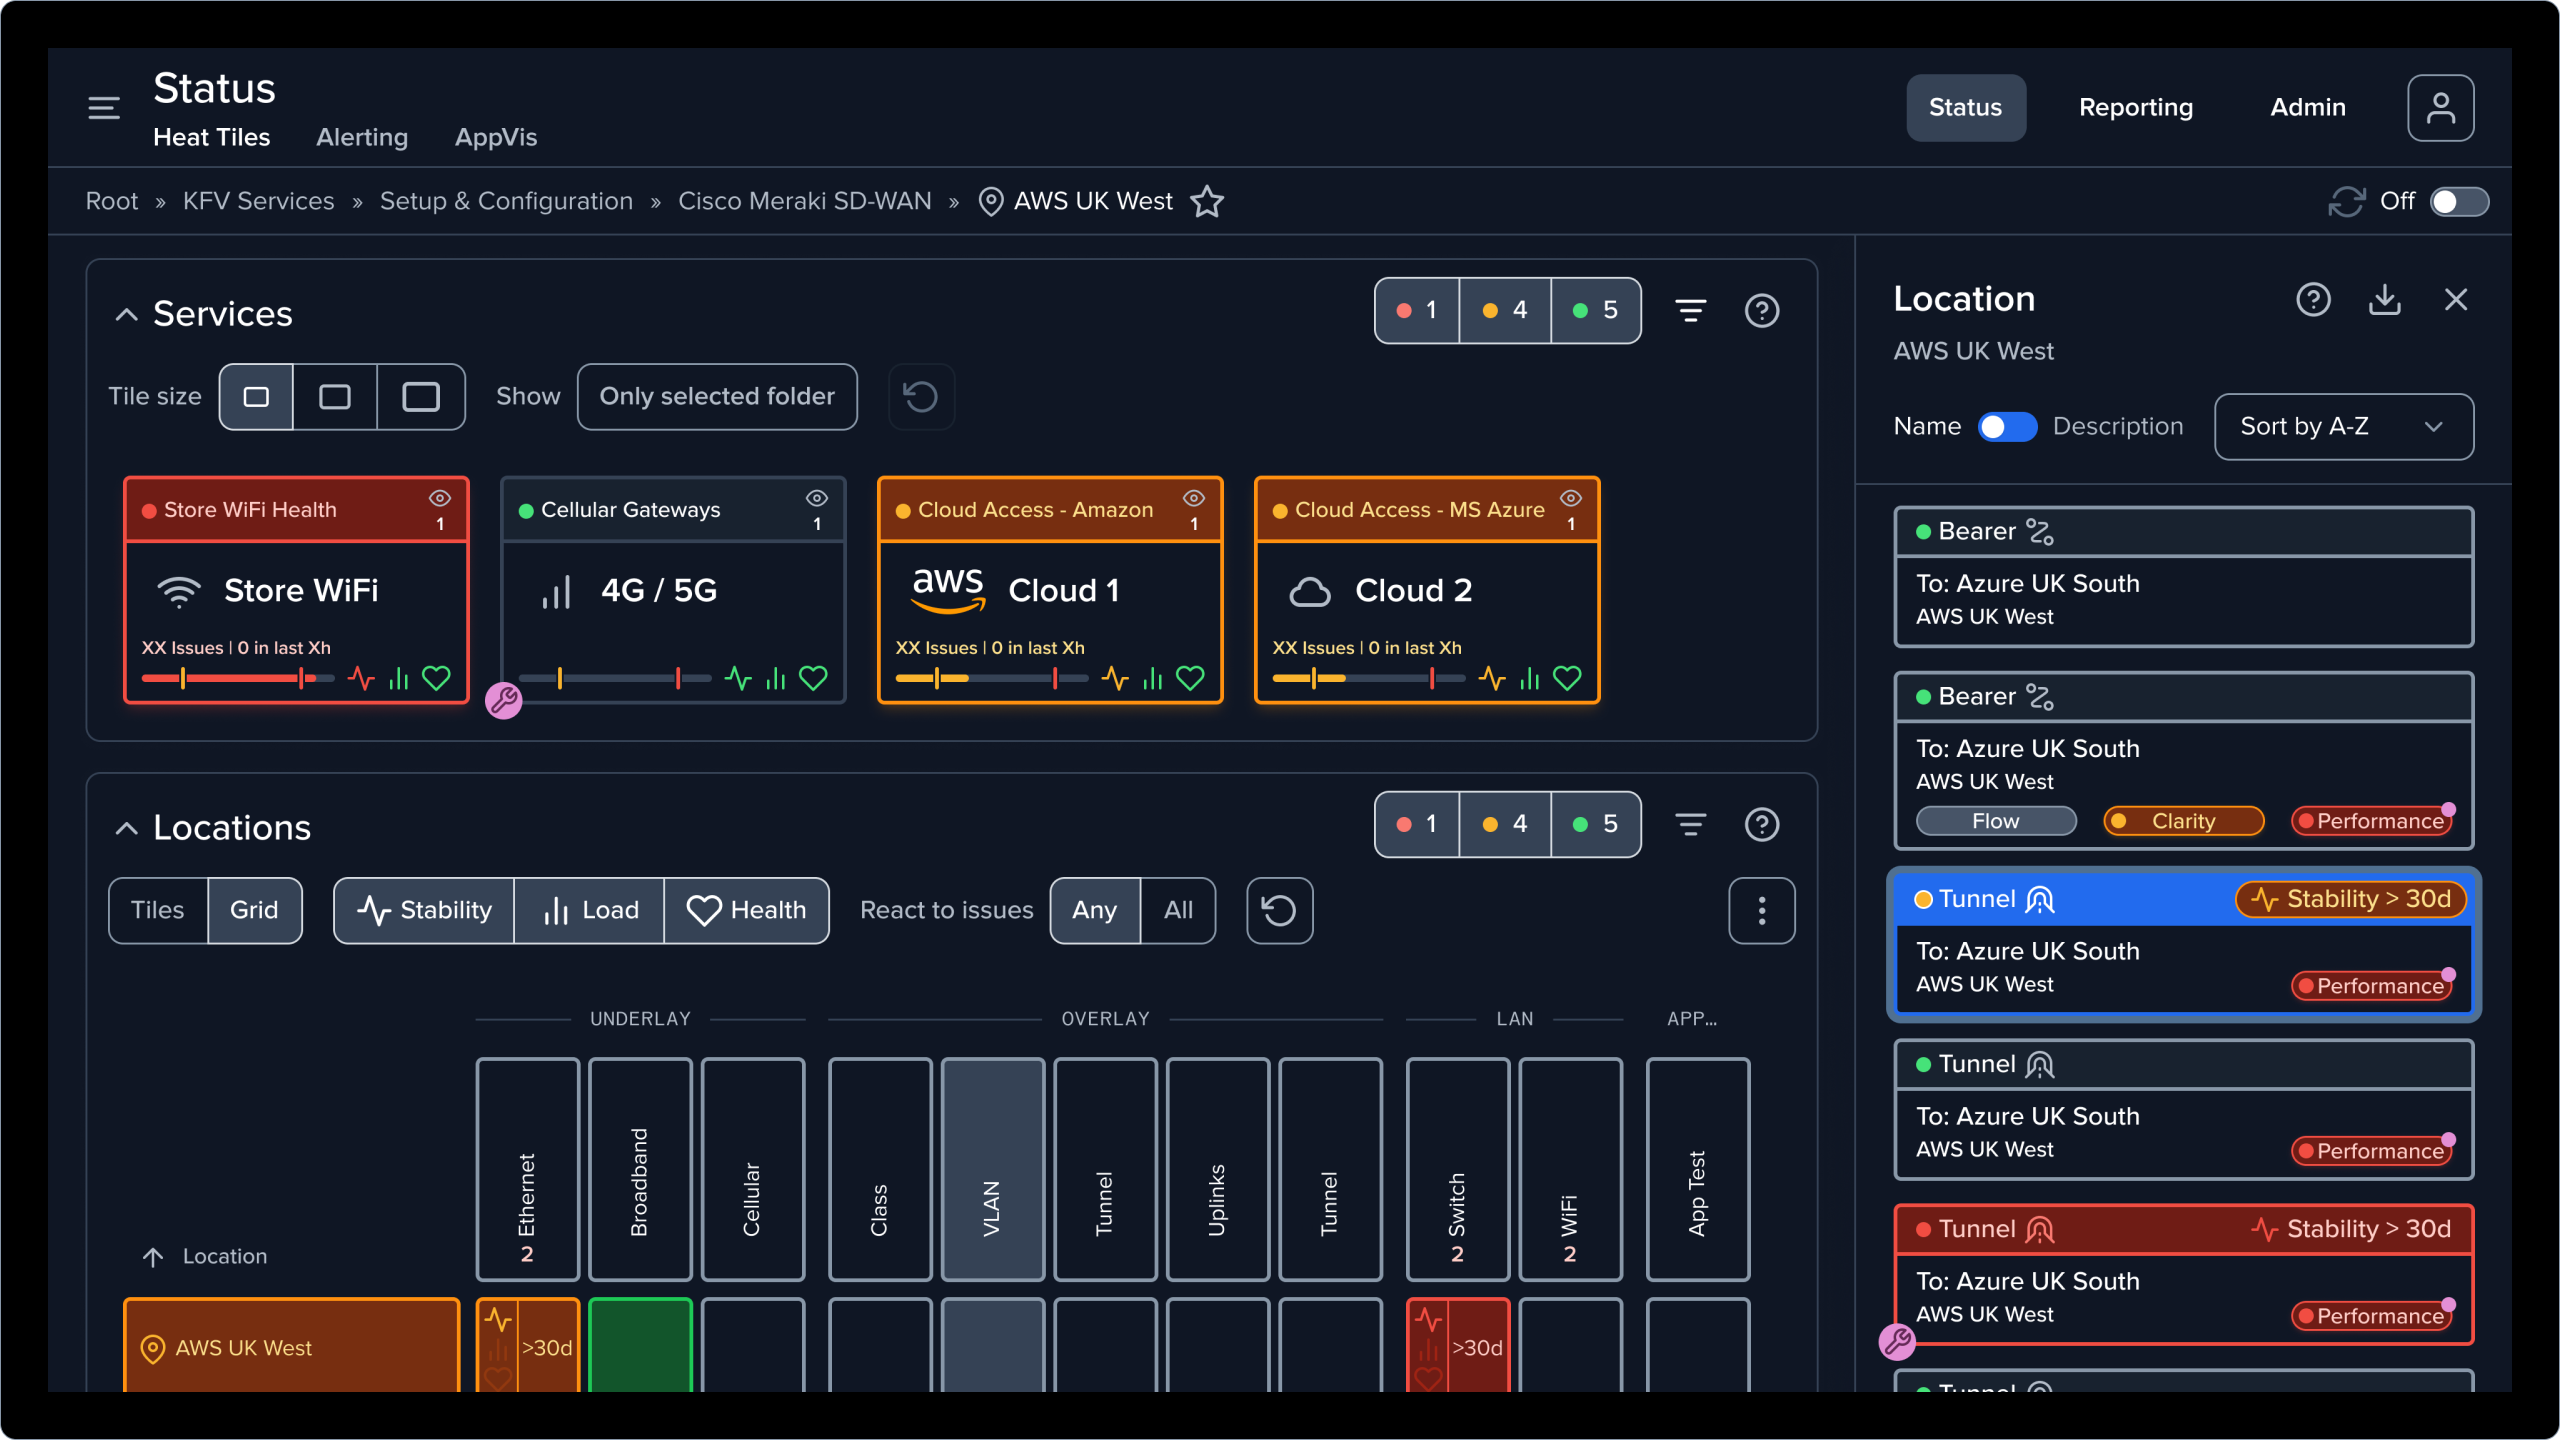
Insight UI offers both light and dark modes—with dark mode easing eye strain for regular screen users—while maintaining consistent colour coordination and ensuring an accessible experience that meets WCAG 2.0 Level AA standards for users with visual impairments.
“Once I logged in to Highlight, I found it to be extremely intuitive. I just immediately knew what I was looking at and I understood. I literally taught myself Highlight in half a day. I didn’t need to look anything up. I could figure out how to do reporting and figure out how to look at the various networks. It’s highly intuitive and Insight UI is amazing.”

Behz Akhund
Vice President of Delivery at Horizon River