We’re excited to announce the latest addition to the Highlight Service Assurance Platform, the Reporting Insights page. This new page provides all Highlight users with a customisable tile-based reporting hub that displays visual month-to-month comparisons on a wide variety of different metrics.
The Reporting Insights page gives both managed service providers, their customers and network managers a way to easily analyse and share network service performance metrics in a visually pleasing and easily understandable way, making network service reviews far less time-consuming and much more productive.
The anatomy of the Reporting Insights page
Available immediately to all Highlight users, the Reporting Insights page summarises all the relevant service information from a chosen customer location or folder using a series of optional tiles and tables. The available tiles include:
- Link availablity
- Links with issues
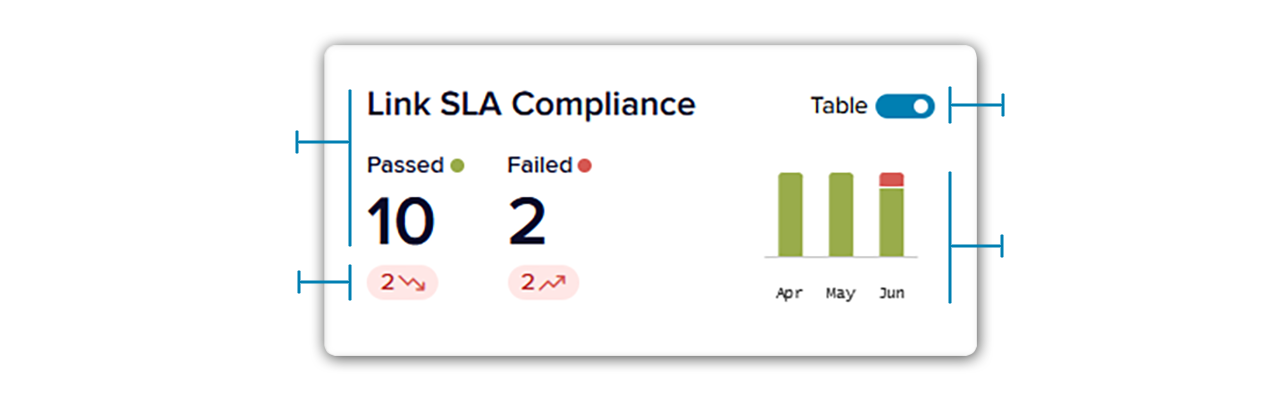
- Link SLA compliance
- Outage duration total
- Tunnel availability
- Watches created
- Devices by vendor
- More tiles to be added in the future
Each of these tiles shows how services in the chosen location or folder are performing in relation to a specific metric for the chosen month, such as how many links within the folder are complying with SLA limits, including the option to dive deeper with togglable tables.
The tile also displays a relevant chart showing how this metric has changed over the previous three months. Additionally, there are colour-coded trend indicators showing if the specific tile metric is either improving or degrading in comparison to the previous month.
Users can determine how many of these tiles and accompanying tables appear at any one time. Once the view has been set for any particular folder or location, the configuration is stored so that the page remains in the same state the next time it is viewed.
Presentation is everything when it comes to service assurance engagement

The Reporting Insights page enables managed service engagement by empowering service managers with a way to give customers a transparent and visually pleasing look into how their services are performing without having to spend hours compiling and styling report data from multiple different sources.
By openly sharing accessible performance data, Reporting Insights enhances the partnership and mutual accountability between all parties, ultimately resulting in more productive conversations, more loyal customers and reduced churn rates. When customers witness tangible efforts to improve their services, their loyalty grows stronger.
See Reporting Insights in action today
The Reporting Insights page is available right now to every Highlight user.
- If you’re an existing user, just log into your account and visit the reporting section of any location or customer folder to get started building your customised Reporting Insights pages.
- If you’re not already using the Highlight platform, see Reporting Insights for yourself in our prepared demo environment by signing up for a 14-day free trial using the form on this page.
- For any other questions about the Highlight platform, don’t hesitate to contact us.