SD-WAN Service Observability Enablement with Highlight
SD-WAN technology is proving to be a go-to solution for multisite, centrally managed networks. The appeal of a smart and highly flexible management layer on the network is strong, especially for organisations with locations all over the world.
IT managers and service providers, however, can often find managing and assuring SD-WAN solutions a challenge.
Enter the Highlight Service Observability Platform – the ultimate cloud-based service observability enablement solution for SD-WAN service management and comprehensive network visibility.

Enhance your SD-WAN management efficiency with these key features
Minimal setup and continually updated cloud platform
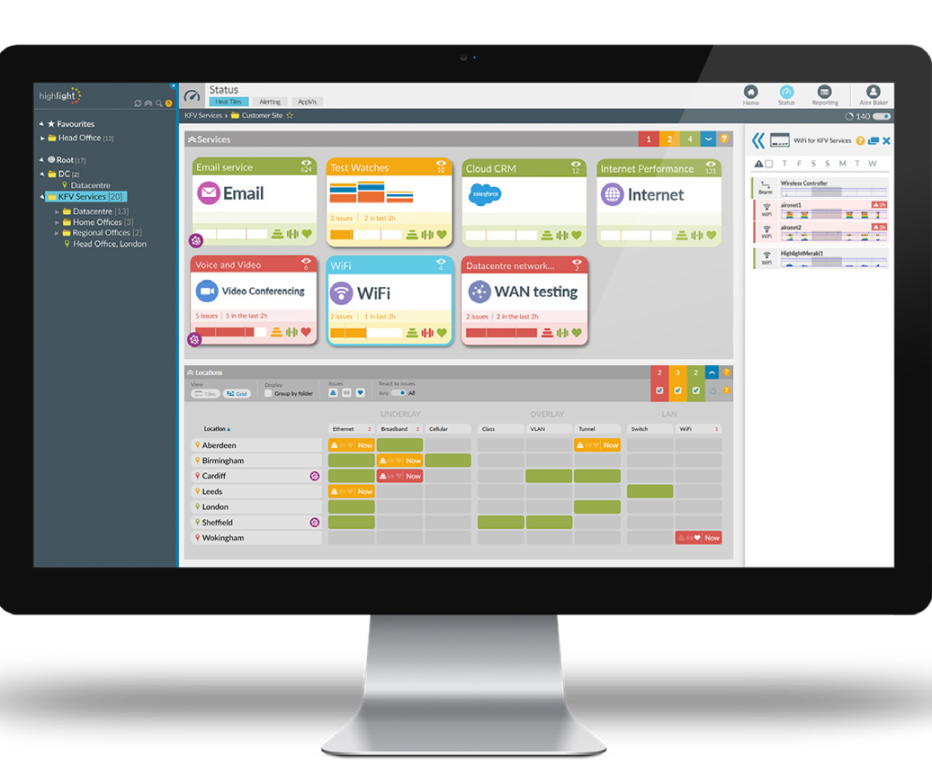
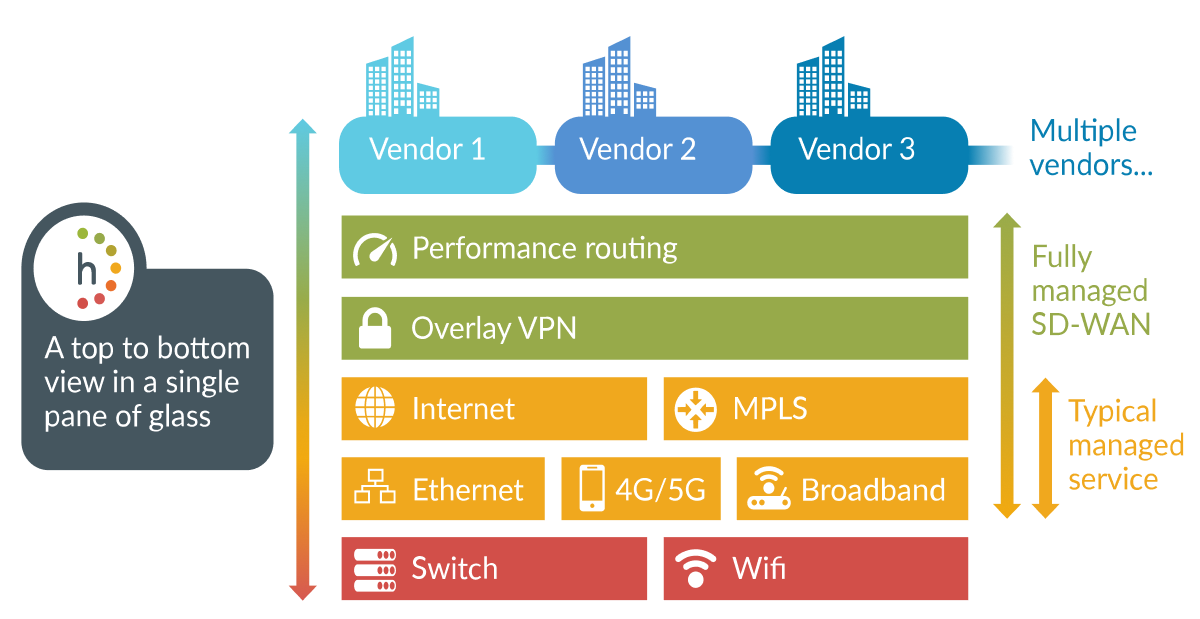
Comprehensive multi-vendor visibility of underlay, LAN and SD-WAN overlay connections
Organised, visually pleasing representation of the service for intuitive problem solving
Multi-tenant access structure means users see only what’s relevant to their specific role
Integrated, standardised reporting capabilities to inform intelligent decision makin
Granular and highly flexible thresholds and alerting sensitivity to eliminate false positives
Comprehensive SD-WAN service observability enablement
The need for service observability in SD-WAN networks
SD-WAN can considerably improve the optimisation of network performance and the deployment of security policies. However, positive network user experience relies heavily on how the SD-WAN overlay components interact with the underlay and LAN network elements.
Service observability looks at the how all these various connections interact as a single network service and establishes the processes and policies required to provide end-users with a reliable and positive service experience. This is why you need to have full visibility and understanding of the performance of all network components. The Highlight Service Observability Platform provides that visibility.

Improved problem solving with integrated multi-vendor visibility
The Highlight Service Observability Platform is vendor-agnostic, meaning that performance of any combination of compatible services by supported vendors, such as SD-WAN, cellular, ethernet and broadband, can be displayed in a single view.
Data from each different vendor is translated into stability, load and health in a way that is standardised, making information from different vendors easily understandable and comparable. This enables you to find the origin of problems quickly, for example isolating whether an issue at a location is down to the SD-WAN setup or is being affected by the underlying local connectivity.

Increase support process efficiency with multi-tenancy
Downstream user visibility of each network environment can also be granted by using the Highlight platform’s multi-tenant access tree structure. Highlight multi-tenancy ensures that users can only see the information they’re supposed to see. The clear, visual and understandable nature of Highlight performance metrics enables both technical and non-technical roles to make assessments about where problems are occurring.
This means that support calls for very simple and easily solvable problems are reduced, and when calls do occur, first line support staff are able to use real-time and historical metrics to easily communicate with users and drastically increase the quality and success of first-touch communication instances.

Avoid alert storms with targeted alerts and exceptions
Highlight’s alerting system is designed specifically to give you the power to define exactly what issues you want to be aware of , whilst avoiding annoying and unnecessary alert storms that clog up inboxes and increase response times and support costs. Reaction sensitivity, problem categorisation, connection and folder exceptions, business hour settings and per-alert contact designation – all ensure alert relevancy on any watched connection or group of connections.

Justified decision making with unified reporting
The Highlight platform has a dedicated on-demand reporting suite that enables you to create unified and detailed reports on any combination of network service element. These reports can be stored as templates and re-run at the click of a button or scheduled at regular intervals. Data can also be extracted into external data analysis platforms, such as Power BI, utilising the platform’s automated Reporting API.

Take the first step towards making your network service work for you
Request a demonstration of the platform directly with a Highlight team member to discuss specific challenges, ask technical questions, or simply walk through some actual usage examples.
Get more information about:
- Introduction to Highlight
- What Highlight can do for you
- Getting closer to your customer
- Building partnerships
- Real-world use cases
- Installation and maintenance
- Customer service
